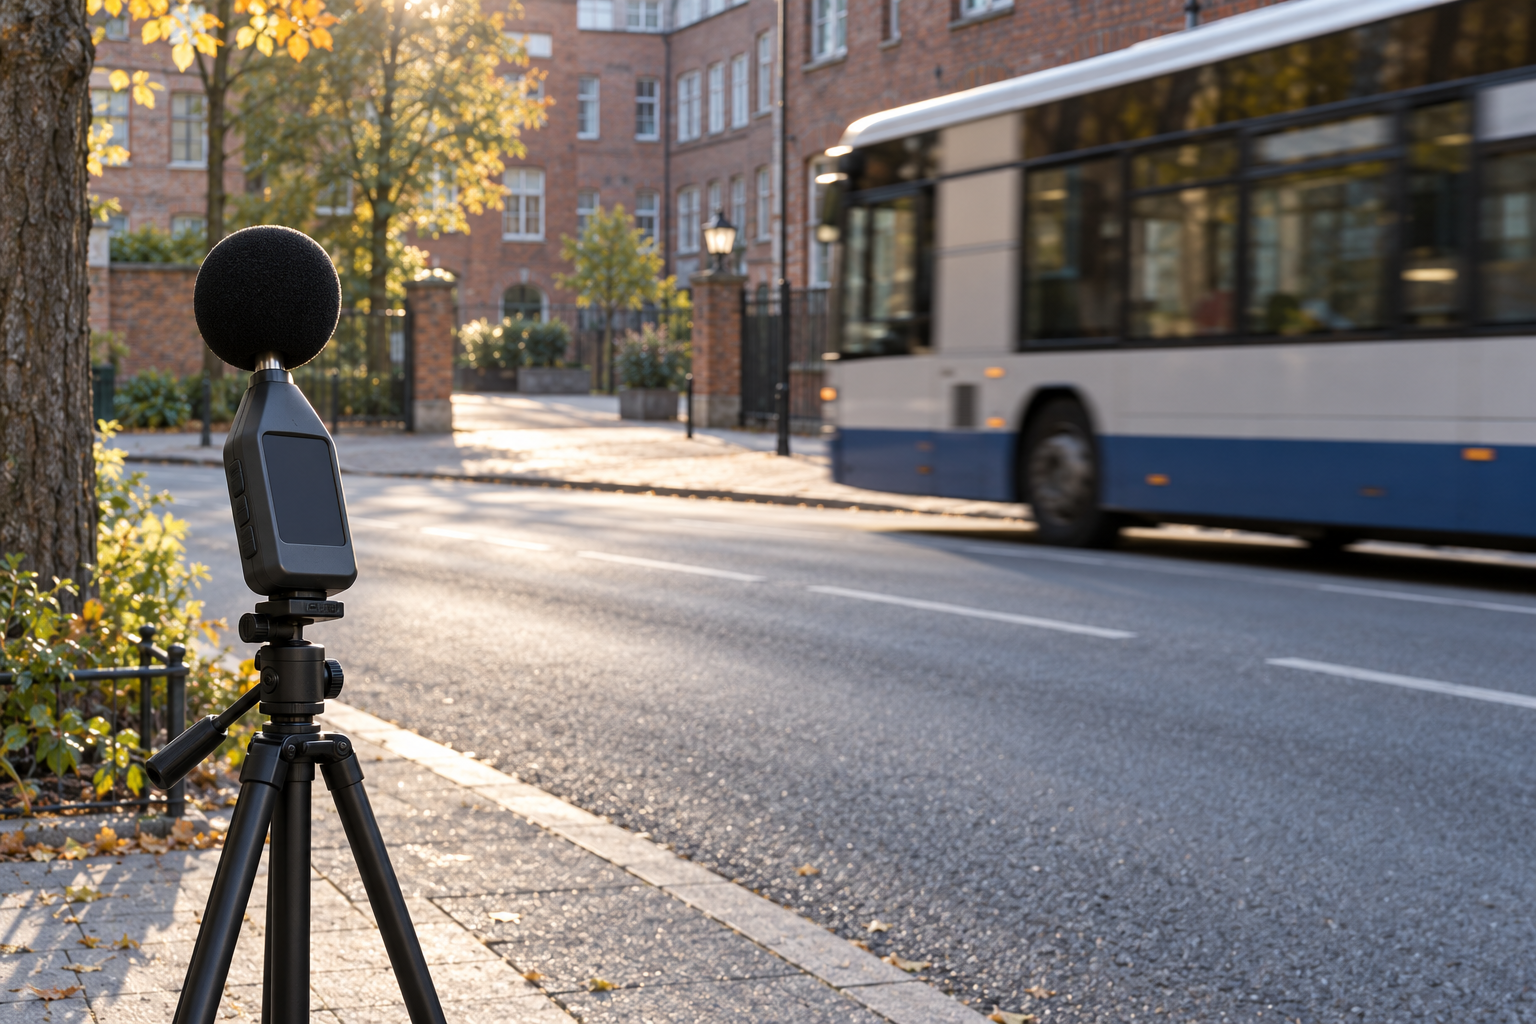
Suppose a meter runs for an hour beside a street. For much of it there is tire hiss in the distance. Then a bus climbs past the microphone, its engine close enough to interrupt a conversation. At the end, the meter gives one number: the equivalent continuous sound level for that hour. The bus is in the number, but the interruption is not. To understand what a place sounds like, we need to know what the meter kept and what it put aside.
The reading most often used for this purpose is LAeq,T: an A-weighted equivalent sound level over a stated time, T. It answers a useful question. What steady A-weighted sound would carry the same measured acoustic energy as the changing sound during this interval? The Federal Highway Administration's noise-measurement handbook uses the equivalent level in highway studies because it makes different stretches of traffic measurable on a common basis. A number alone, however, cannot tell us whether the hour held a continuous wash or a few conspicuous pass-bys.
An average with a particular memory
Decibels are logarithmic, so the meter does not add its decibel readings and divide by their count. It averages the sound's frequency-weighted squared pressure over the chosen period, then expresses the result in decibels. That energy accounting gives the louder moments considerable weight. In a simple comparison, a sound 10 dB louder for one-tenth as long contributes the same energy as the quieter sound sustained for the whole interval. That is a statement about the measurement, not a claim that the two experiences feel alike. The IEC sound-level-meter specification distinguishes instruments that display time-weighted levels from integrating-averaging meters that calculate time-averaged levels, while the FHWA handbook explains how equivalent levels are used in the field.
The T deserves as much attention as the number. LAeq over a minute containing one bus is not directly the same observation as LAeq over an hour of traffic. Extending the interval can dilute a short event with quieter time, or catch events a brief sample misses. For a highway assessment, the FHWA says to choose when, how long, and how often to measure according to the study's purpose; the loudest traffic hour need not be the congested rush hour. “The noise level was 60 dB” leaves out the interval that makes the reading interpretable.
The hour has a shape
Other descriptors preserve parts of that shape. The FHWA's sound-level descriptor guide defines L10 as the level exceeded for 10 percent of a measurement period, L50 for half the period, and L90 for 90 percent. L90 often helps describe the quieter background against which passing vehicles stand out. These are percentiles of measured level, not percentages of acoustic energy. LAeq and L90 together say more than either alone, though neither names the bus or tells us exactly when it passed.
A maximum adds another piece, provided its label is complete. LAFmax is the highest A-weighted level displayed using the meter's Fast time weighting; Fast smooths the changing signal over a short response time. LCpeak is a C-weighted peak sound pressure and captures a different property of a brief impulse. The NIOSH sound-level-meter guide lists equivalent level, maximum level and C-weighted peak separately, and sets Fast and Slow as distinct response settings. A “maximum dB” without weighting and response time can therefore hide a consequential choice. For very sharp, high-level impulses, NIOSH also warns that an instrument can clip the peak; a reassuring-looking readout cannot repair a measurement that overloaded its microphone or electronics.
The level history itself is often the clearest companion to an average. A graph of short intervals shows whether a loud contribution came in one cluster, at regular gaps, or throughout the hour. A field note can identify a passing bus, roadworks or a leaf blower, while leaving an uncertain sound unidentified. The graph and note do something no new scalar can do: they keep the order of events.
Equal numbers, different sounds
An A-weighted figure also compresses frequency. A-weighting reduces the contribution of lower frequencies relative to the middle of the range; C-weighting and Z-weighting use different responses. The NIOSH guide explains these settings and why the chosen weighting must travel with the number. Two sounds with the same LAeq can have different low-frequency content, tones, or fluctuations. A-weighting is useful for many exposure and environmental measures, but it is not a full account of a sound's character.
The listening evidence makes the distinction concrete, and also cautions against a simple rule about which pattern people dislike. In a 2010 laboratory experiment, Tomasz Kaczmarek and Anna Preis arranged the same 120 recorded vehicle pass-bys into four ten-minute sequences with equal LAeq. Listeners rated the evenly distributed traffic more annoying than the most clustered version. That is a result for those constructed sequences and listeners, not a verdict on every street. In a 2021 experiment with 31 participants and 18 traffic recordings, Jan Felcyn found sound level, rather than the tested time patterns, was the statistically significant factor in annoyance ratings; participants' comments nevertheless tended to favor steady over intermittent sound. Those findings do not line up as a universal preference, but both show why an average is only part of a listening question.
Frequency and rhythm can matter together. In a 2018 controlled listening study, 52 people rated broadband sounds held at the same 40 dBA LAeq while researchers changed spectral shape and amplitude modulation. Ratings rose with greater low-frequency content and deeper periodic modulation within the tested sounds. Laboratory ratings are short-term judgments of selected stimuli. They do not establish how a particular neighborhood will respond over months, but they demonstrate an information loss: equal A-weighted energy does not imply equal acoustic texture or equal ratings in every setting.
Give the number its setting
The microphone also has a location and a day. Move it near a reflecting wall, into wind, or closer to a road, and the result can change without any change in the source. The FHWA field handbook calls for a recorded microphone position, calibration, windscreen and weather conditions, and attention to nearby sounds that could contaminate a traffic measurement. These details are not ceremony. They tell a later reader what was actually measured and whether two numbers can fairly be compared.
A useful account of the street might therefore report LAeq,T with its start time and duration, add a level history and an appropriate background percentile, identify the weighting and any maximum or peak measure, and note the microphone's position and the events heard. The selection depends on the question: a highway model, a workplace exposure survey and a resident's complaint require different evidence. The equivalent level remains a powerful summary of measured energy. Its honesty lies in the word equivalent. It gives us one steady level in place of an hour that was never steady.
A thought worth keeping?